
The Colorado Avalanche are the wonderkids of the NHL this season. Nobody expected them to find any success this year, and yet they finished first overall in the Central Division with an astounding 112 points on the season. This was simply incredible, shocking and quite frankly unexpected.
The question is, was it all just an illusion? If you believe advanced statistics in hockey are able to identify “contenders” and “pretenders”, well then Colorado would likely fall into the “pretenders” category.
Regular Season Advanced Stats
The following chart shows the Fenwick For Percentage of the Colorado Avalanche this season, basically it shows that the Avalanche were consistently out shot and as such the correlation that comes with being outshot is that the other team has a significant advantage in time of possession as well. The less time a team possess a puck combined with getting heavily out shot, is often an indicator that your team is playing above their means thanks to extenuating circumstances, such as PDO which will be discussed later in this same article.
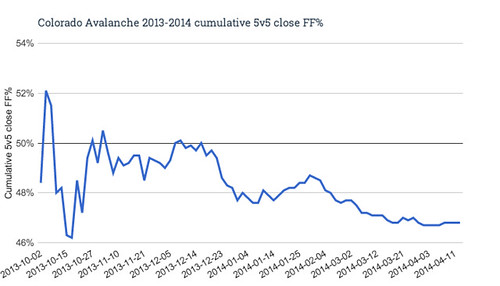
That chart from extraskater.com summarizes the Avs entire season Close Fenwick%. The horizontal line indicates the 50% mark, in other words being below it is not a great spot to be. For example here is a similar chart but for their central division rival St. Louis Blues.
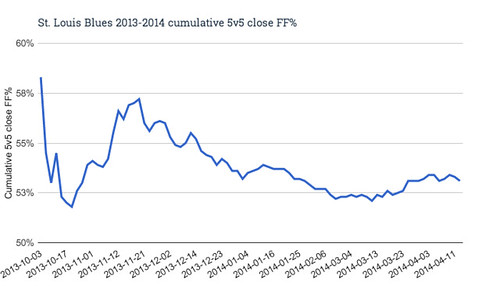
You can barely see the 50% marker in this chart because the Blues are so high above it all season long. Indicating they were indeed outplaying opponents on a consistent basis. Puck possession and scoring opportunities were heavily in their favor from Game 1 of the regular season through to Game 82.
Back to the Avalanche: looking at their chart most people would simply write off something like advanced statistics, citing that they finished ahead of the Blues despite the fact that their Fenwick metric was ghastly in comparison. This is where the PDO metric comes into play. PDO is a tracker of Team SH% plus Team SV%. It is essentially how lucky a team is. SH% and SV% are huge factors in the outcomes of games, and for inexplicable reasons sometimes teams have incredible seasons in both or one of these categories. When they do, they are sitting on top of the world. So when teams have poor possession metrics, but very good PDO measurements, this is an indication that they are on the right side of the hockey gods. Having a Vezina nominated goalie doesn't hurt either.
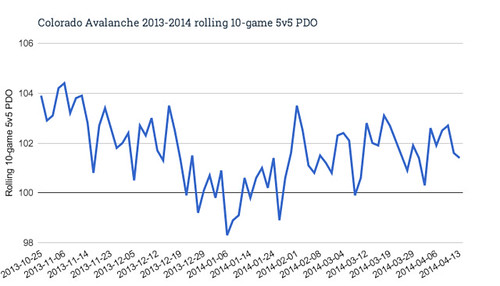
Here you see Colorado’s season PDO metric. The Avalanche finished 3rd overall in this metric this season. This indicates that despite finishing fourth last in the entire league in terms of possession metrics, Colorado was saved by their PDO. The problem is that PDO is unstable, and when you are being grossly out-possessed and as such outshot and out chanced on a nightly basis, well we all saw what happened to Toronto this season…
The point is that Colorado has been playing with fire all season long. They have been riding the luck train straight through to first in their division. The problem is that at some point the averages always balance out, that’s why their averages. SH% and SV% are not metrics that are directly attributable to team systems. Maybe they are influenced to a certain degree, but certainly don’t play a huge factor in their outcome.
Colorado has been celebrated as a team that had a very impressive turnaround, one that should be celebrated. And yet, the advanced statistics tell a more cautionary tale. They tell us that the Avalanche and their fans could be in for a rude awakening.
Playoffs
So now we get to the playoffs, surely Colorado has turned these things around right…Not exactly. As of this morning Colorado sits dead last in FF% for the playoff teams with just 37.1%. Yet there they are once again fourth overall in PDO with a 103.9 measurement. They are still riding high on their luck measurement, and found some success early on in their series with Minnesota. But once again, luck runs out at a certain point.
Here is a look at the Fenwick chart for Thursday nights game in Minnesota. A game that saw the Wild heavily outplay Colorado.
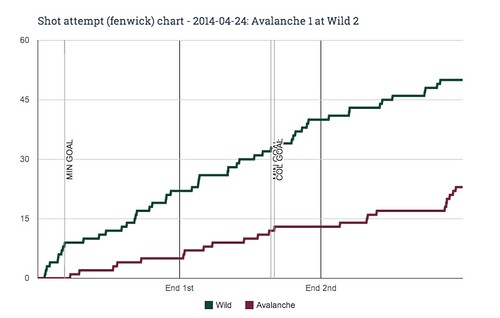
Right from the get-go things were ugly for the Avs. Despite the score being 2-1, they were heavily outplayed. If not for Varlamov this game would’ve been a runaway for Minnesota.
So now the question is why does PDO have to even out? Why isn’t it just that Semyon Varlamov is going to remain as a premier goaltender in the NHL and continue to post numbers good enough to keep Colorado afloat. The simple answer is that he might. Varlamov could be the next great goaltender to be in the NHL and may find great success long enough for Colorado to become a possession team. It has happened in the past, and it will happen in the future. But these are exceptional circumstances. Just ask Toronto Maple Leaf fans and management what happened when Jonathan Bernier and James Reimer were no longer posting above average SV%. Their late season 8 game losing streak, which essentially eliminated them from these playoffs are all the proof needed.
SH% and SV% will average out. Having one incredible season in these two metrics will only hide the truth for so long. With Colorado having such a terrible puck-possession game, it is only a matter of time before they go all Maple Leafs on us. It could be happening right now as they are in the midst of a two game losing streak, or it could happen midway through next season. We don’t know when luck runs out, we do know that unless they find a way to suddenly become a puck-possession team, or at the very least find a way to cut down on scoring opportunities against, their luck will indeed run out. It’s just a matter of time.
Then again, the Avs are in the playoffs and anything can happen. That's why they play the games.
All charts and information relating to them can be found at extraskater.com